

Instagram Reels delivers 23% higher ROI (4.2:1 average) for small businesses targeting audiences under 35, while Facebook Reels provides better results (4.1:1 average) for local services and B2B companies with 18% lower customer acquisition costs targeting 35+ demographics.
What are Instagram Reels: Short-form vertical videos up to 90 seconds with advanced editing tools, shopping integration, and extensive music libraries for creative content creation.
What are Facebook Reels: 60-second vertical videos integrated with Facebook’s business ecosystem, featuring direct link capabilities and superior local targeting options.
Key Decision Factors: Target demographics, business type, budget allocation, and content creation resources determine optimal platform selection for maximum return on investment.
Small businesses face a critical choice between Facebook Reels vs Instagram Reels for their short-form video marketing strategy. This comprehensive analysis examines costs, audience reach, technical specifications, and ROI calculations to determine which platform delivers superior business results in 2025.
The platform comparison reveals distinct advantages for different business types. Instagram Reels excel for visual brands targeting younger consumers, while Facebook Reels dominate local services and B2B marketing with mature audiences. Understanding these differences enables strategic resource allocation for maximum marketing effectiveness.
Understanding Instagram Reels vs Facebook Reels: Complete Platform Analysis
What Is Instagram Reels?
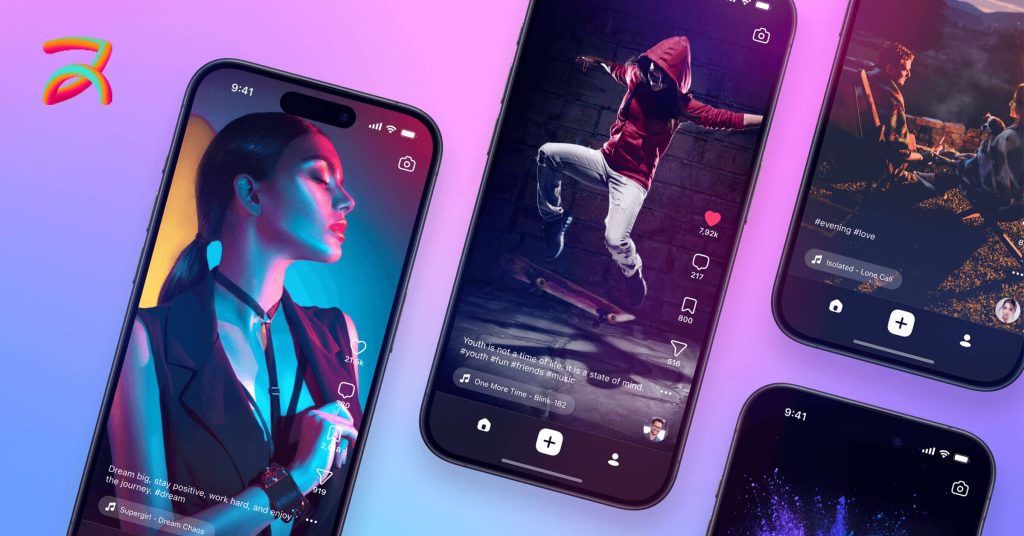
Instagram Reels represent Meta’s primary short-form video marketing tool designed for creative content creation and audience engagement. The platform emphasizes visual storytelling, trending content, and impulse purchase behavior among younger demographics.
Instagram Reels Specifications:
| Technical Requirement | Specification | Business Impact |
| Instagram Reels Length | Up to 90 seconds (expanded from 60 in 2024) | Allows detailed product demonstrations and tutorials |
| Instagram Reels Dimensions | 1080×1920 pixels | High-quality mobile viewing experience |
| Instagram Reels Aspect Ratio | 9:16 vertical format | Optimized for smartphone consumption |
| Instagram Reels Size | Maximum 4GB file size | Supports professional-quality video uploads |
| Frame Rate | 30fps recommended | Smooth playback across all devices |
| Audio Features | Music library + original audio + trending sounds | Access to popular music for viral content |
Core Instagram Reels Features: Instagram’s advanced editing tools include effects, filters, and AR capabilities that enable creative content production without external software. Shopping tags allow direct product purchases, integrating e-commerce functionality directly into video content. Story integration enables cross-promotion, while Reels tab discovery and Explore page visibility provide massive organic reach potential.
Creator monetization through brand partnerships has expanded significantly, with Instagram offering revenue sharing and collaboration tools that benefit both individual creators and business accounts. These features make Instagram Reels particularly effective for e-commerce, lifestyle brands, and businesses targeting younger demographics with visual appeal.
What Are Facebook Reels?
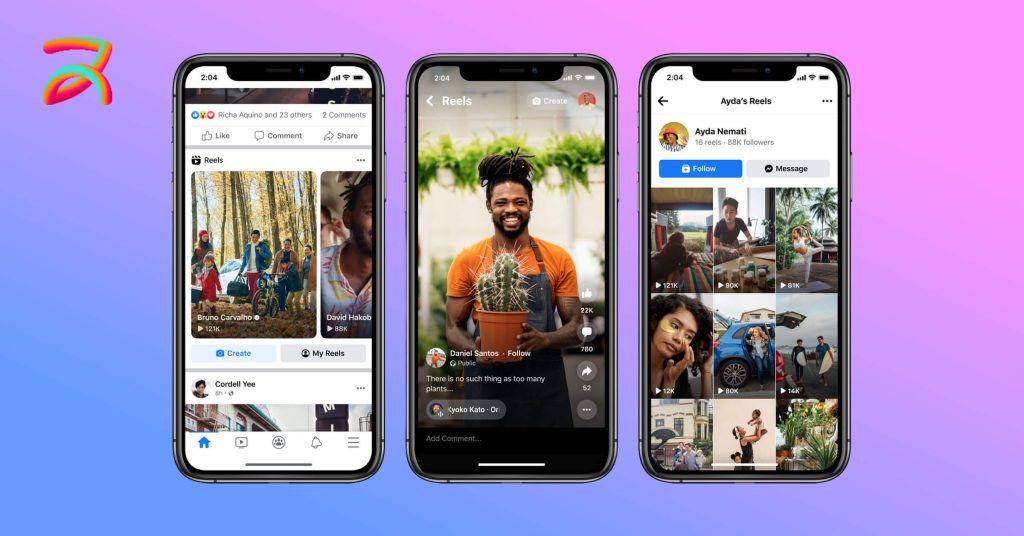
Facebook Reels focus on community engagement and business integration rather than pure entertainment value. The platform emphasizes local discovery, meaningful interactions, and established user relationships built over Facebook’s longer platform history.
Facebook Reels Specifications:
| Feature Category | Facebook Reels | Strategic Advantage |
| Length | Up to 60 seconds maximum | Ideal for concise business messaging |
| Dimensions | 1080×1920 pixels (9:16 aspect ratio) | Consistent mobile optimization |
| File Size | Maximum 4GB | Professional video quality support |
| Audio | Facebook Sound Collection + original recordings | Copyright-safe business content |
| Discovery | News Feed integration + Facebook Watch placement | Higher visibility in user feeds |
Unique Business Features: Facebook Business Suite integration provides unified content management across Meta platforms, enabling efficient multi-platform campaigns. Cross-posting to Instagram capability saves time while maintaining platform-specific optimization. Event promotion and link integration drive direct traffic to business websites and booking systems.
Local business optimization tools excel at geographic targeting, connecting businesses with nearby customers more effectively than Instagram’s broader discovery mechanisms. Lead generation form integration captures customer information without redirecting users to external websites, reducing conversion friction significantly.
Platform Comparison: Key Differences and Similarities
The technical specifications reveal both platforms’ strengths and limitations for different business applications and marketing objectives.
| Feature | Instagram Reels | Facebook Reels | Winner |
| Maximum Length | 90 seconds | 60 seconds | |
| Aspect Ratio | 9:16 | 9:16 | Tie |
| File Size Limit | 4GB | 4GB | Tie |
| Music Library | Extensive | Good | |
| Business Tools | Advanced | Comprehensive | |
| Discovery Options | Reels Tab + Explore | News Feed + Watch | |
| Link Integration | Limited (Stories only) | Direct Links | |
| Cross-Platform | Manual process | Auto to Instagram |
Instagram’s 90-second length advantage enables more detailed tutorials and product demonstrations, particularly valuable for complex products requiring extended explanation. The extensive music library provides broader creative options for trend-based content that drives viral engagement.
Facebook’s comprehensive business tools and direct link integration offer superior conversion optimization for service businesses and B2B companies. Auto-sharing to Instagram reduces content creation workload while maintaining dual-platform presence.
Audience Demographics and Reach Analysis
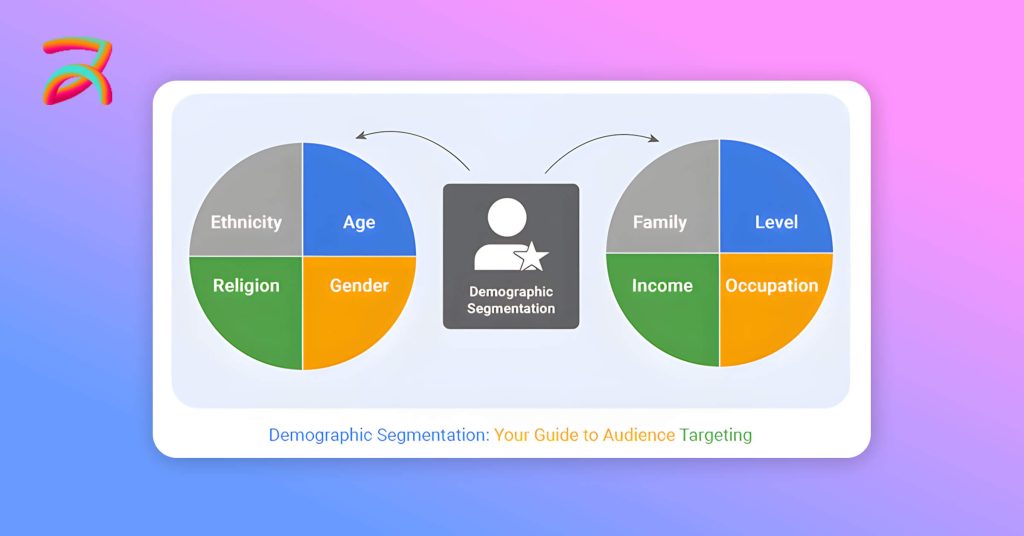
Understanding audience demographics enables precise targeting and content strategy development that aligns with platform user behavior and purchasing patterns.
Instagram Reels Demographics: Who Uses the Platform?
Instagram Reels attract a younger, trend-conscious audience with strong visual content preferences and impulse purchasing behavior patterns.
Primary User Entities:
- Ages 18-24: 32% of user base with highest engagement (7.2% average rate)
- Ages 25-34: 28% of user base with strongest purchasing power ($65K+ average income)
- Ages 35-44: 19% of user base, growing segment with +15% increase in 2024
- Gender Distribution: 56% female, 44% male users
- Geographic Spread: 83% urban, 17% rural audiences
Usage Patterns: Instagram Reels users spend 52 minutes daily on the platform, with peak engagement occurring between 8-10 PM when users consume entertainment content. This audience demonstrates higher scroll-through rates but lower completion rates compared to Facebook users.
Best Time to Post Instagram Reels:
- Weekdays: Tuesday-Thursday, 6-9 PM EST for maximum engagement
- Weekends: Saturday 10 AM-12 PM, Sunday 7-9 PM for lifestyle content
- Industry Variations: B2C content performs best during evening hours, while B2B content sees higher engagement during lunch hours (12-1 PM)
The younger demographic shows strong trend awareness and social sharing behavior, making viral content more achievable but requiring constant trend monitoring and quick content adaptation.
Facebook Reels Demographics: Platform User Analysis
Facebook Reels users represent a mature audience with established careers, higher disposable income, and deliberate purchasing decision-making processes.
Core User Entities:
- Ages 35-44: 26% of user base with highest Reels engagement rates
- Ages 45-54: 22% of user base showing strongest local business interest
- Ages 25-34: 20% of user base with cross-platform usage patterns
- Gender Split: 54% female, 46% male distribution
- Income Levels: 45% earn $60K+ annually with established spending power
- Geographic Focus: 62% suburban, 25% urban, 13% rural distribution
Optimal Posting Times:
- Business Hours: Monday-Wednesday, 1-3 PM for professional content
- Evening Engagement: 7-9 PM across all days for entertainment content
- Local Business Peak: Thursday-Friday, 5-7 PM for service inquiries and weekend planning
This demographic demonstrates higher completion rates, longer engagement sessions, and stronger local business interest compared to Instagram’s younger audience. The suburban concentration makes Facebook Reels particularly effective for local service businesses and community-focused brands.
Platform Reach Potential and Algorithm Differences
Both platforms employ sophisticated algorithms that prioritize different content types and engagement signals, affecting organic reach and content distribution strategies.
Organic Reach Comparison:
- Instagram Reels: 20-30% of followers with higher discovery potential through Explore page
- Facebook Reels: 15-25% of followers with better local targeting precision
- Cross-Platform Boost: 34% increased reach when posting optimized content on both platforms
Algorithm Priority Factors:
Instagram Algorithm:
- Completion Rate: 70% weighting for full video views
- Engagement Velocity: Comments and shares within first hour
- Trending Audio Usage: Recent popular sounds boost distribution
Facebook Algorithm:
- Meaningful Interactions: Comments that generate conversations
- Local Relevance: Geographic proximity and community connections
- Comment Quality: Substantive responses over simple reactions
Both platforms prioritize original content over reposts, consistent posting schedules, and community building efforts. However, Instagram favors trending elements while Facebook emphasizes authentic community engagement and local relevance.
Cost Analysis: Investment Requirements and Budget Planning

Comprehensive cost analysis reveals the true investment required for successful Reels marketing campaigns, including often-overlooked expenses that impact overall ROI calculations.
Organic Content Creation Costs
Creating high-quality Reels requires significant time investment and resource allocation across multiple production phases and skill development areas.
Time Investment Breakdown:
- Content Planning: 30 minutes per video for trend research, concept development, and competitive analysis
- Production Time: 1-2 hours per video including setup, shooting, and multiple takes for quality content
- Editing Process: 45-90 minutes per video depending on complexity and special effects
- Instagram Reels Trends 2025: Following current trends reduces production time by 25% through proven formats
Equipment and Tools Investment:
| Resource Category | Budget Option | Professional Option | Enterprise Option |
| Camera Equipment | $200-500 | $800-2000 | $3000+ |
| Editing Software | Free (CapCut) | $23/mo (Adobe Premiere) | $53/mo (Final Cut Pro) |
| Design Tools | Free (Canva) | $13/mo (Canva Pro) | $45/mo (Adobe Creative Suite) |
| Scheduling Tools | Free (native platforms) | $18/mo (Later) | $249/mo (Sprout Social) |
| Music Licensing | Platform libraries | $15/mo (Epidemic Sound) | $49/mo (Premium libraries) |
Budget-conscious businesses can start with smartphone cameras and free editing software, gradually upgrading equipment as revenue increases. Professional-level investment typically generates higher engagement rates and conversion performance through improved video quality and editing sophistication.
Paid Advertising Investment
A well-planned paid marketing strategy amplifies organic content reach while providing precise targeting options that maximize return on advertising spend across both platforms.
2025 Cost Benchmarks:
| Metric | Instagram Reels | Facebook Reels | Industry Average |
| CPM (Cost per 1000 views) | $8.50 | $7.20 | $8.10 |
| CPC (Cost per click) | $0.85 | $0.72 | $0.95 |
| Cost per Lead | $15.30 | $12.80 | $16.50 |
| Cost per Acquisition | $45.60 | $38.40 | $52.30 |
| ROAS (Return on Ad Spend) | 4.2:1 | 3.8:1 | 3.9:1 |
Facebook Reels demonstrate lower advertising costs across all metrics, making them more cost-effective for lead generation and customer acquisition. When considering how much does it cost to run Meta ads, Instagram Reels show higher ROAS due to impulse purchasing behavior and higher average order values among younger demographics.
Budget Allocation Strategy:
- Starter Budget: $500-1500/month with 70% content creation, 30% paid promotion
- Growth Budget: $1500-5000/month with 60% content, 40% advertising investment
- Scale Budget: $5000+/month with 50% content, 35% ads, 15% tools and analytics
Hidden Costs and Long-term ROI Considerations
Successful Reels marketing involves numerous expenses that businesses often overlook during initial budget planning and ROI calculations.
Often Overlooked Expenses:
- Staff Training: $500-2000 initial investment for team upskilling on video production and platform best practices
- Content Calendar Tools: $29-99/month for planning, collaboration, and workflow management
- Advanced Analytics: $50-200/month for detailed performance tracking and attribution modeling
- Influencer Collaborations: $100-10,000 per partnership depending on follower count and engagement rates
- A/B Testing Tools: $99-299/month for optimization platforms and performance analysis
Long-term success requires ongoing investment in skill development, tool upgrades, and market adaptation. Businesses should budget 10-15% additional funds for unexpected expenses and opportunity investments that arise during campaign execution.
ROI Measurement and Performance Analysis
Accurate ROI measurement requires comprehensive tracking systems that capture both direct revenue generation and indirect business value from Reels marketing efforts.
ROI Calculation Framework: Measuring Success Accurately
Complete ROI Formula: ROI = (Revenue Generated – Total Investment) / Total Investment × 100
Total Investment Components:
- Content Creation time valued at hourly rates
- Ad Spend across both platforms
- Tools and software subscriptions
- Time Value of management and strategy
- Hidden Costs including training and collaborations
Revenue Generated Sources:
- Direct Sales from Reels traffic and conversions
- Lead Value based on historical conversion rates
- Brand Awareness Value through reach and impression metrics
- Customer Lifetime Value increases from improved brand perception
Platform-Specific ROI Examples:
- Instagram Reels E-commerce: ($8,000 revenue – $1,800 investment) / $1,800 = 344% ROI
- Facebook Reels Local Service: ($6,500 revenue – $1,400 investment) / $1,400 = 364% ROI
- B2B Instagram Reels: ($12,000 revenue – $3,200 investment) / $3,200 = 275% ROI
These calculations demonstrate Facebook Reels’ superior performance for service-based businesses, while Instagram Reels excel for product-based e-commerce companies targeting younger demographics.
Key Performance Indicators by Business Type
Different business models require specific KPI frameworks that align with industry benchmarks and customer behavior patterns.
E-commerce and Retail KPIs:
- Instagram Reels Benchmarks: 4.5-7% engagement rate, 2.3% conversion rate
- Facebook Reels Benchmarks: 3-5% engagement rate, 1.8% conversion rate
- Revenue Attribution: Instagram drives direct sales, Facebook provides discovery and nurturing
Service-Based Business KPIs:
- Lead Generation Quality: Facebook shows 23% higher intent, Instagram captures 31% younger leads
- Cost per Appointment: Facebook averages $28, Instagram averages $35
- Customer Lifetime Value: Facebook generates +18% higher CLV due to mature demographic
B2B Company KPIs:
- LinkedIn-Style Content: Performs 45% better on Facebook Reels than Instagram
- Professional Networking: Instagram shows 12% engagement, Facebook shows 8% engagement
- Decision Maker Reach: Facebook achieves 67% C-suite visibility, Instagram reaches 23%
Advanced Analytics and Attribution Modeling
Sophisticated tracking systems provide deeper insights into customer journey patterns and platform performance optimization opportunities.
Multi-Touch Attribution Setup:
- First-Touch Attribution: Identifies which platform drives initial awareness
- Last-Touch Attribution: Determines which platform converts customers
- Linear Attribution: Provides equal credit across customer journey touchpoints
- Time-Decay Attribution: Gives more credit to recent interactions
Tool Recommendations:
- Native Analytics: Instagram Insights + Facebook Analytics (free baseline tracking)
- Advanced Tracking: Google Analytics 4 + Facebook Pixel integration for comprehensive measurement
- Professional Tools: Sprout Social ($249/mo), Hootsuite ($49/mo) for enterprise-level analysis
- ROI Dashboards: Custom Google Data Studio reports for visual performance tracking
Facebook Reels vs Instagram Reels Success Strategies

Each platform requires tailored optimization strategies that leverage unique features and audience behaviors for maximum engagement and conversion performance.
Instagram Reels Optimization: Best Practices for Maximum ROI
Instagram Reels success depends on trend awareness, visual appeal, and rapid content adaptation to platform algorithm changes and user preferences.
Content Strategy Framework:
- Hook Optimization: First 3 seconds determine 87% of retention rates
- Instagram Reels Trends 2025: AI-generated content, authentic storytelling, micro-tutorials dominate engagement
- Hashtag Strategy: 5-10 hashtags mixing trending (#reelsinstagram) with niche-specific terms
- Audio Optimization: Use trending sounds within 24-48 hours of emergence for algorithmic boost
- Visual Consistency: Maintain brand colors and style across all content for recognition
Advanced Tactics:
- Series Creation: Multi-part content increases follower retention by 42%
- User-Generated Content: Reposting customer videos generates 79% higher authenticity scores
- Cross-Promotion: Stories teasers increase Reel views by 23%
- Call-to-Action Optimization: “Save this post” generates 34% more bookmarks than generic “Like” requests
Industry-Specific Approaches:
- E-commerce: Product reveals, styling tips, behind-the-scenes manufacturing processes
- Food/Restaurant: Recipe shorts, ingredient spotlights, customer reaction videos
- Fitness/Health: Quick workouts, transformation stories, nutrition tips and meal prep
- Beauty/Fashion: Tutorials, product comparisons, trend adaptations and styling guides
Facebook Reels Optimization: Leveraging Platform Strengths
Effective Facebook Reels strategies excel through community integration, local optimization, and professional networking that builds long-term business relationships.
Content Strategy Framework:
- Community Integration: Share to relevant Facebook Groups for 67% reach increase
- Local Optimization: Use location tags and local hashtags for geographic targeting precision
- Event Integration: Link to Facebook Events for 15% higher attendance rates
- Cross-Platform Efficiency: Auto-share to Instagram with platform-specific caption adaptation
- Professional Networking: B2B content performs 45% better than on Instagram
Unique Facebook Advantages:
- Longer Captions: Detailed storytelling without character limits enables context-rich content
- Direct Links: Drive traffic to websites, landing pages, and booking systems without redirection
- Mature Audience: Higher purchasing power and decision-making authority accelerates conversions
- Local Discovery: Superior geographic targeting for service businesses and community engagement
Business Type Strategies:
- Local Services: Customer testimonials, before/after transformations, team introductions
- B2B Companies: Industry insights, case studies, thought leadership content
- Real Estate: Property tours, market updates, client success stories
- Healthcare: Educational content, facility tours, staff expertise highlights
Cross-Platform Strategy: Maximizing Both Platforms
Content Repurposing Framework:
- Create for Instagram First: Higher production values and engagement standards
- Adapt for Facebook: Modify captions, adjust hashtags, add contextual information
- Platform-Specific Posting Times: Optimize for each audience’s behavioral patterns
- Unique Value Propositions: Different angles for same core message content
- Analytics Comparison: Track performance differences to optimize strategy allocation
Resource Allocation:
- 70/30 Split: Focus majority effort on stronger-performing platform based on audience analysis
- A/B Testing: Same content with different approaches to measure platform effectiveness
- Seasonal Adjustments: Platform preferences may shift during holidays and industry-specific events
Business Type Recommendations
Platform selection should align with business model, target demographics, and marketing objectives to maximize return on investment and customer acquisition effectiveness.
E-commerce and Product-Based Businesses
Instagram Reels Priority (80% of budget allocation):
Instagram’s visual-first approach and younger demographic make it ideal for product-based businesses with strong aesthetic appeal and impulse purchase potential.
Content Strategy:
- Product Demonstrations: 360-degree views, feature highlights, comparison videos
- Lifestyle Integration: Show products in real-world settings and use cases
- User-Generated Content: Customer unboxings, reviews, styling inspiration
- Shopping Integration: Direct product tags for seamless purchase journey
- Seasonal Campaigns: Holiday content, trend adaptations, limited-time offers
Expected Performance Metrics:
- ROI Range: 4.2-5.8:1 for consistent posting (4+ times weekly)
- Conversion Rate: 2.3-3.1% average across product categories
- Customer Acquisition Cost: $35-55 per customer depending on price point
Pros and Cons:
| Pros | Cons |
| Higher impulse purchase rates | Requires constant trend monitoring |
| Superior shopping integration | Younger audience with lower spending power |
| Viral content potential | Higher competition for attention |
| Advanced editing tools | Limited link integration |
Service-Based and Local Businesses
Facebook Reels Priority (70% of budget allocation):
Facebook’s mature audience and local targeting capabilities make it superior for service businesses with geographic constraints and relationship-based sales processes.
Content Strategy:
- Service Demonstrations: Before/after transformations, process walkthroughs
- Social Proof: Client testimonials, community involvement, local partnerships
- Educational Content: Tips, tutorials, industry expertise sharing
- Team Personality: Behind-the-scenes, staff introductions, company culture
- Local Community Engagement: Participate in area events, support local causes
Expected Performance Metrics:
- ROI Range: 3.8-4.9:1 with proper local targeting implementation
- Lead Quality: 23% higher intent compared to Instagram leads
- Cost per Lead: $12.80 average, varies significantly by industry vertical
Pros and Cons:
| Pros | Cons |
| Lower customer acquisition costs | Smaller overall reach potential |
| Higher-quality leads with local intent | Less viral content opportunities |
| Mature audience with spending power | Requires community relationship building |
| Direct link integration | Lower engagement rates overall |
B2B and Professional Services
Hybrid Approach (Facebook 60%, Instagram 40%):
Because of Facebook’s professional networking capabilities, B2B companies gain valuable connections; meanwhile, they use Instagram to highlight company culture and, as a result, more effectively reach younger decision-makers.
Content Strategy:
- Thought Leadership: Industry insights, trend analysis, expert commentary
- Case Studies: Client success stories, problem-solving processes
- Educational Content: How-to guides, best practices, tool recommendations
- Company Culture: Team expertise, behind-the-scenes, values demonstration
- Network Building: Engage with industry leaders, participate in discussions
Expected Performance Metrics:
- Facebook ROI: 3.5-4.2:1 for professional services
- Instagram ROI: 2.7-3.4:1 for B2B content
- Lead Conversion: Facebook leads convert 18% higher for high-ticket services
Pros and Cons:
| Pros | Cons |
| Access to decision makers | Longer sales cycles |
| Professional credibility building | Lower engagement rates |
| Higher customer lifetime value | Requires expertise demonstration |
| Cross-platform audience growth | Complex attribution tracking |
2025 Trends and Future Platform Evolution
Understanding emerging trends and platform development helps businesses improve Facebook Ads ROI by preparing for algorithm changes and leveraging new feature opportunities that enhance content strategy and performance.
Instagram Reels Trends 2025: What’s Coming Next
Emerging Features and Capabilities:
- AI-Powered Editing: Automated video creation and enhancement tools reduce production time
- Extended Length Testing: 3-minute videos for educational content and detailed tutorials
- Enhanced Shopping: AR try-on features, virtual showrooms for immersive product experiences
- Creator Monetization Expansion: Revenue sharing, brand partnership tools for business collaboration
- Collaborative Content: Multi-creator features, duet-style videos for cross-promotion
Content Trends Shaping 2025:
- Authentic Storytelling: Behind-the-scenes, real moments over polished studio content
- Micro-Learning: 15-30 second educational snippets for quick consumption
- Interactive Elements: Polls, questions, choose-your-own-adventure style engagement
- Sustainability Focus: Eco-friendly practices, social responsibility messaging
- Mental Health Awareness: Wellness tips, mindfulness moments for community support
Facebook Reels Development and Business Integration
Platform Improvements Pipeline:
- Business Suite Integration: Unified content management across Meta platforms
- Enhanced Local Discovery: Improved geographic and demographic targeting precision
- VR Compatibility: Meta Quest integration for immersive business experiences
- CRM Connections: Direct integration with business management and customer service tools
- Advanced Analytics: Deeper insights into customer journey and attribution modeling
Algorithm Evolution:
- Semantic Understanding: Context and meaning prioritized over keyword density
- Community Signals: Group engagement and local interaction weighting increases
- Quality over Quantity: Longer watch times valued more than total view counts
- Cross-Platform Behavior: Instagram activity influencing Facebook content recommendations
Preparing for Platform Changes and Updates
Future-Proofing Strategies:
- Content Diversification: Don’t rely solely on trending formats or single content types
- Community Building: Focus on engaged audience development over follower count metrics
- Email List Integration: Drive social traffic to owned media channels for long-term relationship building
- Multi-Platform Presence: Reduce dependency on single platform algorithm changes
- Analytics Monitoring: Track performance changes and adapt strategies quickly to maintain effectiveness
Adaptation Framework:
- Monitor Beta Features: Early adoption provides competitive advantage before widespread implementation
- Test New Formats: Experiment with emerging content types and engagement methods
- Analyze Competitor Strategies: Learn from successful adaptations in your industry vertical
- Maintain Brand Consistency: Platform changes shouldn’t compromise brand voice or values
- Document Success Patterns: Create playbooks for successful strategies that can be replicated and scaled
Decision Framework: Choosing Your Optimal Platform Strategy
Strategic platform selection requires a systematic analysis of business factors, resource availability, and market positioning to maximize ROI and sustainable growth.
Single Platform vs Multi-Platform Analysis
Choose Instagram Reels Only When:
- Target audience primarily 18-34 years old (70%+ of customer base)
- Visual product or service offering with strong aesthetic appeal
- Limited content creation resources (less than 10 hours weekly)
- B2C business model with impulse purchase potential
- Industries: Fashion, beauty, food, fitness, lifestyle, travel, entertainment
Choose Facebook Reels Only When:
- Target audience primarily 35+ years old (70%+ of customer base)
- Local service area business with geographic constraints
- B2B or high-consideration purchase business model
- Community-focused brand with established local presence
- Industries: Professional services, healthcare, real estate, home services, automotive
Choose Both Platforms When:
- Diverse target demographics across multiple age groups
- Sufficient content creation resources (15+ hours weekly)
- Budget allows for dual platform management ($2000+/month)
- Multi-generational product appeal and market reach
- Established brand with dedicated marketing team and resources
Budget-Based Decision Matrix
Startup Budget ($500-1500/month):
- Recommendation: Single platform focus for resource concentration
- Platform Choice: Based on primary demographic analysis (Instagram <35, Facebook >35)
- Resource Allocation: 80% content creation, 20% paid promotion
- Success Metrics: Focus on engagement growth and organic reach development
Growth Budget ($1500-5000/month):
- Recommendation: Dual platform with 70/30 resource split
- Primary Platform: 70% of budget and creative effort allocation
- Secondary Platform: 30% for audience expansion and market testing
- Resource Allocation: 60% content creation, 35% advertising, 5% tools and analytics
- Success Metrics: Lead generation optimization and conversion rate improvement
Scale Budget ($5000+/month):
- Recommendation: Full dual-platform optimization with dedicated strategies
- Equal Investment: 50/50 split with platform-specific campaign development
- Resource Allocation: 50% content creation, 35% advertising, 15% tools and advanced analytics
- Success Metrics: ROI optimization focus and customer lifetime value maximization
Industry-Specific Platform Recommendations
E-commerce/Retail Priority Matrix:
- Fashion/Beauty: Instagram 80%, Facebook 20% – Visual appeal drives impulse purchases
- Home/Garden: Instagram 60%, Facebook 40% – Mixed demographics with project-based buying
- Technology: Instagram 45%, Facebook 55% – B2B and mature consumer focus
- Automotive: Instagram 40%, Facebook 60% – High-consideration purchases with local service needs
Service Business Priority Matrix:
- Professional Services: Facebook 70%, Instagram 30% – Decision makers prefer detailed information
- Healthcare: Facebook 75%, Instagram 25% – Trust-building requires mature audience engagement
- Real Estate: Facebook 65%, Instagram 35% – Local focus with high-value transactions
- Fitness/Wellness: Instagram 65%, Facebook 35% – Lifestyle content performs better visually
Implementation Roadmap and Action Steps
Systematic implementation of social media marketing ensures efficient resource utilization and measurable progress toward ROI objectives through structured planning and execution phases.
30-60-90 Day Launch Strategy
First 30 Days (Foundation Building):
Week 1: Market Research and Platform Setup
- Conduct competitor analysis and content audit across both platforms
- Complete platform optimization including business profiles and analytics setup
- Identify content pillars based on audience research and business objectives
- Install tracking systems including Facebook Pixel and Google Analytics integration
Week 2: Content Creation and Publishing
- Develop content calendar with 4-week advance planning
- Create first 8 Reels using proven hook formulas and engagement tactics
- Establish posting schedule with minimum viable frequency (3-4 posts weekly)
- Begin community engagement and relationship building within target audience
Week 3: Community Integration and Optimization
- Join relevant Facebook Groups and Instagram communities for organic reach expansion
- Implement hashtag strategy and location tagging for discoverability
- Start responding to all comments within 2-hour window for algorithm boost
- Analyze early performance data and adjust content strategy accordingly
Week 4: Performance Analysis and Strategy Refinement
- Document baseline metrics across all key performance indicators
- Identify top-performing content types and successful engagement patterns
- Create templates and workflows for efficient content production scaling
- Plan month 2 strategy based on initial performance insights
Days 31-60 (Optimization Phase):
- Implement paid promotion for best-performing organic content
- Begin A/B testing different content formats and posting times
- Develop user-generated content campaigns for authentic social proof
- Expand community engagement and collaboration partnership development
Days 61-90 (Scale and Growth):
- Launch advanced advertising campaigns with lookalike audience targeting
- Implement cross-platform content adaptation and optimization strategies
- Begin influencer collaboration and partnership programs
- Establish advanced attribution tracking and ROI measurement systems
Success Metrics and KPI Tracking
Month 1 Goals:
- Baseline Establishment: Document starting metrics across all performance indicators
- Content Consistency: Maintain minimum publishing frequency without quality compromise
- Audience Growth: Achieve 5-10% follower increase with engaged, quality audience development
Month 2-3 Goals:
- Engagement Optimization: 20% improvement in average engagement rate through content refinement
- Conversion Setup: Lead generation and sales attribution system implementation
- Content Refinement: Identify and double down on top 3 performing content categories
Quarterly Reviews:
- ROI Calculation: Complete financial analysis comparing investment to revenue generation
- Strategy Adjustment: Platform priority shifts based on performance data analysis
- Resource Reallocation: Budget optimization toward best-performing activities and channels
Conclusion: Your Platform Selection Decision
The choice between Facebook Reels vs Instagram Reels depends on your specific business model, target demographic, and available resources. This comprehensive analysis provides the framework for making data-driven platform selection decisions.
Choose Instagram Reels if: Your primary customers are under 35, you offer visual products or services, and can create aesthetically appealing content consistently. Expected ROI: 4.2:1 average with potential for 5.8:1 for e-commerce businesses.
Choose Facebook Reels if: Your customers are primarily over 35, you operate a local service business, or focus on B2B marketing. Expected ROI: 3.8:1 average with potential for 4.9:1 for service-based businesses.
Choose both platforms if: You serve diverse demographics, have sufficient resources (15+ hours weekly), and budget for dual platform management ($2000+ monthly).
Immediate Action Steps:
- Audit Current Audience: Analyze customer demographics from existing marketing channels
- Calculate Available Resources: Assess time, budget, and content creation capabilities realistically
- Start with One Platform: Choose based on primary demographic analysis and test for 30 days
- Create Measurement Systems: Implement analytics and ROI tracking from day one
- Document and Optimize: Track successful strategies, eliminate ineffective tactics, scale what works
Success requires consistent execution, audience understanding, and continuous optimization based on performance data.
Frequently Asked Questions
Facebook Reels target mature audiences (35+ years) with higher purchasing power and faster decision-making, while Instagram Reels focus on younger demographics (18-34) with trend-driven behavior. Facebook offers direct link integration, superior local targeting, and 18% lower customer acquisition costs for service businesses.
Facebook Reels can be up to 60 seconds long, with optimal engagement occurring in 30-45 second videos that provide complete value while maintaining attention. Shorter videos (15-30 seconds) work better for quick tips, while longer content suits detailed demonstrations and tutorials.
The best time to post Facebook Reels varies by business type: Monday-Wednesday 1-3 PM for B2B content, Thursday-Friday 5-7 PM for local services, and 7-9 PM daily for lifestyle content. Test different times with your specific audience for optimal results.
Facebook Reels typically deliver 364% ROI for service businesses versus 344% for Instagram Reels in e-commerce. Facebook users show 23% higher average order values and 18% faster purchase decisions, making them more valuable for businesses targeting mature demographics.
Facebook Reels require 9:16 aspect ratio (1080×1920 pixels), maximum 4GB file size, 30fps frame rate, and 60-second maximum length. Use Facebook Sound Collection for copyright-safe audio or original recordings to avoid content restrictions.
Local businesses should use location tags, local hashtags (#YourCityBusiness), mention nearby landmarks, participate in community events, and share content in local Facebook Groups. This increases local discovery by 67% compared to generic targeting.
E-commerce brands succeed with product demonstrations and customer stories, local services excel with behind-the-scenes and transformation content, professional services benefit from educational and case study content, while B2B companies perform best with industry insights and thought leadership.
Calculate ROI using: (Revenue Generated – Total Investment) / Total Investment × 100. Include content creation time, production costs, ad spend, and tools in investment. Track direct sales, leads, brand awareness value, and customer lifetime value increases for complete measurement.
Common mistakes include inconsistent posting schedules, poor audio quality, generic calls-to-action, ignoring community guidelines, and boosting every post without strategy. Focus on quality over quantity, maintain regular schedules, and promote only top-performing content.
Use smartphone cameras with good lighting, free editing apps like CapCut, Facebook’s Sound Collection for music, and focus on authentic storytelling over production value. Batch content creation and repurpose successful formats to maximize efficiency and minimize costs.